

 Facebook
 X
X
 Pinterest
 Copy Link
Should I wait???
With everything that is happening in the US and around the world related to COVID-19, many people are wondering, “Should I wait?”… should I wait to sell my home, should I wait to buy a home? There are still many people listing homes for sale and buyers still looking for those homes. Yes, we’ve had to stop all home tours but we’re creative people and there are great resources out there to help like 3D video tours, photos, FaceTime, Zoom meetings, Docusign, eRecording for the county and all sorts of workarounds.
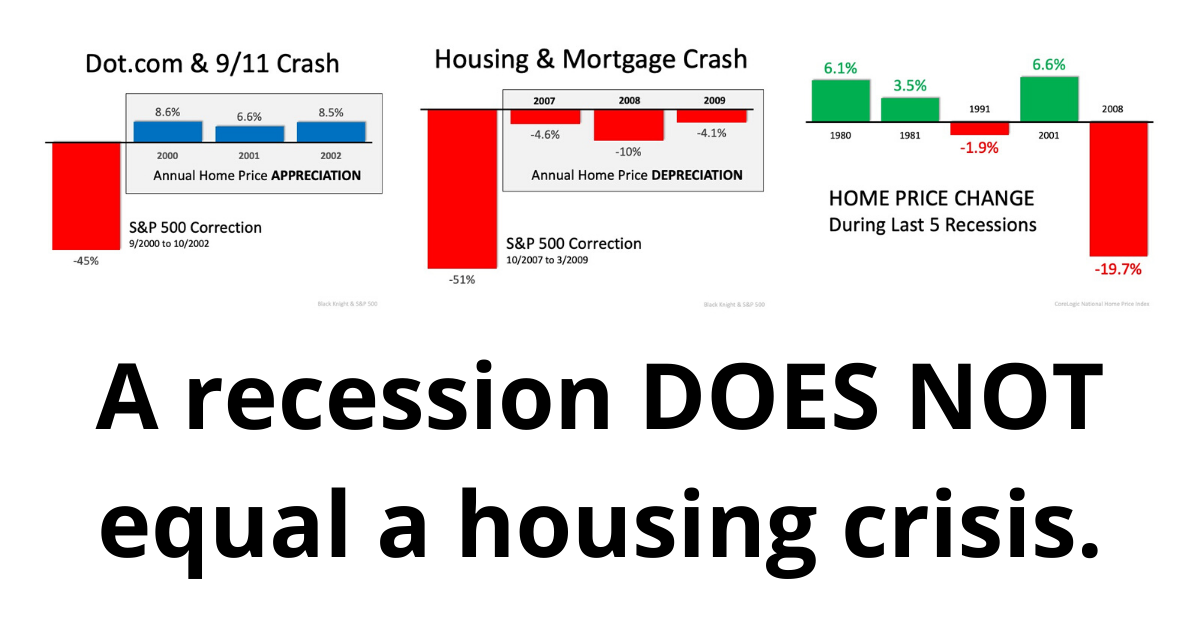
A recession does not equal a housing crisis or “crash” as we saw in 2008.
9/11 has a lot in common with what is happening today. People are avoiding crowds and the same part of the economy is under pressure, restaurants, airlines, hotels, bars, and so on.
If you take a look at the related graph, you see that during the DOT com scare and after the 9/11 terrorism attacks, the stock market showed volatility like we’re seeing today. However, the housing market wasn’t affected, and home prices actually appreciated.
A great analogy was presented to me, 2008 was like a tornado that ripped through and shredded everything and we had to rebuild. All the systems we counted on in banking, mortgage, lending were demolished and it effected everyone. The COVID-19 is more like a giant snowstorm that has hit and we’re all stuck inside. But eventually, it will clear and we will be able to get back out to go about our regular lives… to work, to travel, to our favorite restaurant or bar, movies or theater, and our kids will go back to school. While we may not know what the future holds if you are pausing on buying OR selling a home because you think a recession will cause another housing crisis… they’re not the same thing, and you could be missing out on today’s record-low mortgage rates. Which are still HISTORICALLY low.
Are you thinking about selling your home to move into the right size home for your family? Or ready to downsize to fit your current needs? Do you have questions about selling your home in this market? Give me a call today at 408-465-9290 or DM me to go over your real estate goals.
Two Big Myths in the Home buying Process


The 2020 Millennial Home Buyer Report shows how this generation is not really any different from previous ones when it comes to homeownership goals:
“The majority of millennials not only want to own a home, but 84% of millennials in 2019 considered it a major part of the American Dream.”
Unfortunately, the myths surrounding the barriers to homeownership – especially those related to down payments and FICO® scores – might be keeping many buyers out of the arena. The piece also reveals:
“Millennials have to navigate a lot of obstacles to be able to own a home. According to our 2020 survey, saving for a down payment is the biggest barrier for 50% of millennials.”
Millennial or not, unpacking two of the biggest myths that may be standing in the way of homeownership among all generations is a great place to start the debunking process.
Myth #1: “I Need a 20% Down Payment”
Many buyers often overestimate what they need to qualify for a home loan. According to the same article:
“A down payment of 20% for a home of that price [$210,000] would be about $42,000; only about 30% of the millennials in our survey have enough in savings to cover that, not to mention the additional closing costs.”
While many potential buyers still think they need to put at least 20% down for the home of their dreams, they often don’t realize how many assistance programs are available with as little as 3% down. With a bit of research, many renters may be able to enter the housing market sooner than they ever imagined.
Myth #2: “I Need a 780 FICO® Score or Higher”
In addition to down payments, buyers are also often confused about the FICO® score it takes to qualify for a mortgage, believing they need a credit score of 780 or higher.
Ellie Mae’s latest Origination Insight Report, which focuses on recently closed (approved) loans, shows the truth is, over 50% of approved loans were granted with a FICO® score below 750 (see graph below): Even today, many of the myths of the home buying process are unfortunately keeping plenty of motivated buyers on the sidelines. In reality, it really doesn’t have to be that way.
Bottom Line
If you’re thinking of buying a home, you may have more options than you think. Let’s connect to answer your questions and help you determine your next steps.
Yes, You Can Still Afford a Home


The residential real estate market has come roaring out of the gates in 2020. Compared to this time last year, the number of buyers looking for a home is up 20%, and the number of home sales is up almost 10%. The increase in purchasing activity has caused home price appreciation to begin reaccelerating. Many analysts have boosted their projections for price appreciation this year.
Whenever home prices begin to increase, there’s an immediate concern about how that will impact the ability Americans have to purchase a home. That thinking is understandable. We must, however, realize that price is not the only element to the affordability equation. Mark Fleming, Chief Economist at First American, recently explained:
“When demand increases for a scarce (limited or low supply) good, prices will rise faster. The difference between houses and other goods is that we buy them with a mortgage. So, it’s not the actual price that matters, but the price relative to purchasing power.”
While home prices have risen recently, mortgage interest rates have fallen rather dramatically. At the beginning of last year, the 30-year fixed-rate mortgage stood at 4.46%. Today, that number stands over a full percentage point lower.
How does a lower mortgage rate impact your monthly mortgage payment?
Michael Hyman, a research data specialist for the National Association of Realtors (NAR), explained in a recent report that, even though home values have increased over the last year, the monthly cost of owning a home has decreased:
“With lower mortgage rates compared to one year ago, the payment as a percentage of income fell to 15.5%…from 17.1% a year ago.”
When purchasing a home, the price is not as important as its cost. Today, the monthly expense (cost) of purchasing the same house you could have purchased last year would be less. Or, you could purchase a more expensive home for the same monthly expense.
Fleming, looking at all aspects of the affordability equation (prices, wages, and mortgage rates), calculated the actual numbers in a recent blog post:
“Low mortgage rates and income growth triggered a 13.5% increase in house-buying power compared with a year ago.”
Since wages have increased and mortgage rates have dropped to historically low levels, this is a great time to buy your first home or move up to the home of your dreams. As Tendayi Kapfidze, Chief Economist at LendingTree, recently advised:
“If you are in a point in your life where you’re considering buying a home today, it’s a better time to buy than 10 years ago. If you can get a mortgage, you’re getting much lower interest rates, and it enables you to afford more.”
Bottom Line
Whether you’ve considered becoming a homeowner for the first time or have decided to sell your home and buy one that better suits your current lifestyle, now is a great time to get together and discuss your options.
Equity Gain Growing in Nearly Every State


Rising home prices have been in the news a lot lately, and much of the focus is on whether they’re accelerating too quickly and how sustainable the growth in prices really is. One of the often-overlooked benefits of rising prices, however, is the impact they have on a homeowner’s equity position.
Home equity is defined as the difference between a home’s fair market value and the outstanding balance of all liens on the property. While homeowners pay down their mortgages, the amount of equity they have in their homes climbs each time the value increases.
Today, the number of homeowners that currently have significant equity in their homes is growing. According to the Census Bureau, 38% of all homes in the country are mortgage-free. In a home equity study, ATTOM Data Solutions revealed that of the 54.5 million homes with a mortgage, 26.7% of them have at least 50% equity. That number has been increasing over the last eight years.
CoreLogic also notes:
“…the average homeowner gained approximately $5,300 in equity during the past year.”
The map below shows a breakdown of the increasing equity gain across the country, painting a clear picture that home equity is growing in nearly every state.
Bottom Line
This may be the year to take advantage of your home equity by applying it forward, either as you downsize or as you move up to a new home.
Confidence Is the Key to Success for Young Homebuyers


Buying your first home can seem overwhelming. Thankfully, there’s a lot of great information out there to help you feel more confident as you learn about the process. For those in younger generations who aspire to buy, here are three things to consider sooner rather than later in your journey:
1. Understand What it Takes to Purchase a Home
Overall, Millennials make up the largest group of homebuyers in today’s real estate market, and Gen Z is not too far behind. A recent study shared by Freddie Mac shows, however, that Generation Z isn’t as confident in the homebuying process as Millennials. The best thing potential young buyers can do is understand what it takes to buy a home. Learn as much as you can about the mortgage process, down payment options, and the overall steps to take along the way.
2. Realize Your Opportunity to Build Wealth
Homeownership allows you the chance to put a small portion of the home’s value down when you buy, and then watch your appreciation grow on the full value of the home – not just on the down payment. It’s one of the best investments you can make, and a form of ‘forced savings’ working in your favor over time. The added bonus? You get to live there, too.
3. Find Someone You Trust to Help You Through the Process
Having someone you trust to guide you through this process is invaluable. Finding a local real estate expert to help you navigate through the transaction and feel more confident as you make important decisions could be the best choice you make.
For Millennials and Gen Z’ers thinking about buying, today’s historically low interest rates combined with the outlook for future home appreciation is a big win. This means whatever you buy today, you’ll be bragging about 10 years from now. You can feel confident about that!
Bottom Line
If you’re ready, buying your first home sooner rather than later is one of the best decisions you can make. But there are many things to consider before taking that step, so let’s work together to help you confidently navigate the full journey.
New Homes Coming to the Housing Market This Year

The number of building permits issued for single-family homes is the best indicator of how many newly built homes will begin to come to market over the next few months. According to the latest U.S. Census Bureau and U.S. Department of Housing & Urban Development Residential Construction Report, the number of building permits issued in January was 1,551,000. This is a 9.2% increase from December.
How will this impact buyers?
New inventory means more options. Lawrence Yun, Chief Economist at the National Association of Realtors (NAR), explained how this is good news for the housing market – especially for those looking to buy:
“More construction will mean more housing inventory for consumers in the later months of this year…Spring months could still be quite tough for buyers since it takes time to convert housing starts into actual housing completions.”
How will this impact sellers?
More inventory means more competition. Yun continues to say:
“As trade-up buyers move into these newly completed homes in the near future, their existing homes will be released onto the market.”
Today, because of the tremendous lack of inventory, a seller can potentially anticipate:
- A great sale price on their house as buyers engage in potential bidding wars.
- A quick sale as buyers have little inventory to choose from.
- Fewer hassles as buyers want to smoothly secure a contract.
Bottom Line
If you’re considering selling your house, you’ll want to list sooner rather than later. This way, you’ll get ahead of this new competition coming to market and ensure the most attention toward your listing and the best price for your house.
Real Estate Is Soaring, But Not Like 2008


Unlike last year, the residential real estate market kicked off 2020 with a bang! In their latest Monthly Mortgage Monitor, Black Knight proclaimed:
“The housing market is heating entering 2020 and recent rate declines could continue that trend, a sharp contrast to the strong cooling that was seen at this same time last year.”
Zillow revealed they’re also seeing a robust beginning to the year. Jeff Tucker, Zillow Economist, said:
“Our first look at 2020 data suggests that we could see the most competitive home shopping season in years, as buyers are already competing over…homes for sale.”
Buying demand is very strong. The latest Showing Index from ShowingTime reported a 20.2% year-over-year increase in purchaser traffic across the country, the sixth consecutive month of nationwide growth, and the largest increase in the history of the index.
The even better news is that buyers are not just looking. The latest Existing Home Sales Report from the National Association of Realtors (NAR) showed that closed sales increased 9.6% from a year ago.
This increase in overall activity has caused Zelman & Associates to increase their projection for home price appreciation in 2020 from 3.7% to 4.7%.
Are we headed for another housing crash like we had last decade?
Whenever price appreciation begins to accelerate, the fear of the last housing boom and bust creeps into the minds of the American population. The pain felt during the last housing crash scarred us deeply, and understandably so. The crash led us into the Great Recession of 2008.
If we take a closer look, however, we can see the current situation is nothing like it was in the last decade. As an example, let’s look at price appreciation for the six years prior to the last boom (2006) and compare it to the last six years: There’s a stark difference between these two periods of time. Normal appreciation is 3.6%, so while current appreciation is higher than the historic norm, it’s certainly not accelerating beyond control as it did leading up to the housing crash.
Today, the strength of the housing market is actually helping prevent a setback in the overall economy. In a recent post, Odeta Kushi, Deputy Chief Economist for First American explained:
“While the housing crisis is still fresh on the minds of many, and was the catalyst of the Great Recession, the U.S. housing market has weathered all other recessions since 1980. With the exception of the Great Recession, house price appreciation hardly skipped a beat and year-over-year existing-home sales growth barely declined in all the other previous recessions in the last 40 years…In 2020, we argue the housing market is more likely poised to help stave off recession than fall victim to it.”
Bottom Line
The year has started off very nicely for the residential housing market. If you’re thinking of buying or selling, now may be the time to get together to discuss your options.
10 Steps to Buying a Home [INFOGRAPHIC]
![10 Steps to Buying a Home [INFOGRAPHIC] | MyKCM](https://desireestanley.com/files/2020/03/20200228-MEM-EN-1046x837.jpg)
![10 Steps to Buying a Home [INFOGRAPHIC] | MyKCM](https://files.mykcm.com/2020/02/25113646/20200228-MEM-EN-1046x837.jpg)
Some Highlights:
- If you’re thinking of buying a home and you’re not sure where to start, you’re not alone.
- Here’s a guide with 10 simple steps to follow in the homebuying process.
- Be sure to work with a trusted real estate professional to find out the specifics of what to do in your local area.
The #1 Reason to List Your House Right Now

The success of the U.S. residential real estate market, like any other market, is determined by supply and demand. This means we need to look at how many potential purchasers are in the market versus the number of houses that are available to buy. With early 2020 housing data now rolling in, it’s quite evident there are two big stories impacting this year’s residential real estate market:
1. Buyer demand is already extremely strong
2. Housing supply is at a historically low level
Demand
ShowingTime is a firm that compiles data from property showings scheduled across the country. The latest ShowingTime Showing Index reveals how showings have increased in each of the country’s four regions for five months in a row.
Supply
Move.com also just released information indicating that the number of homes currently for sale has declined rapidly and now sits at the lowest level in almost a decade. They explained,
“National housing inventory declined 13.6 percent in January, the steepest year-over-year decrease in more than 4 years, pushing the supply of for sale homes in the U.S. to its lowest level since realtor.com began tracking the data in 2012.”
In response to these numbers, Danielle Hale, Chief Economist at realtor.com, said,
“Homebuyers took advantage of low mortgage rates and stable listing prices to drive sales higher at the end of 2019, further depleting the already limited inventory of homes for sale. With fewer homes coming up for sale, we’ve hit another new low of for sale-listings in January.”
The decrease in inventory impacted every price range, too. Here’s a graph showing the data released by move.com:
Bottom Line
Since there’s a historic shortage of homes for sale, putting your home on the market today could drive an excellent price and give you additional negotiating leverage when selling your house. Let’s get together to determine if listing your house now is your best move.
How the Housing Market Benefits with Uncertainty in the World


It’s hard to listen to today’s news without hearing about the uncertainty surrounding global markets, the spread of the coronavirus, and tensions in the Middle East, just to name a few. These concerns have caused some to question their investment plans going forward. As an example, in Vanguard’s Global Outlook for 2020, the fund explains,
“Slowing global growth and elevated uncertainty create a fragile backdrop for markets in 2020 and beyond.”
Is there a silver lining to this cloud of doubt?
Some worry this could cause concern for the U.S. housing market. The uncertainty, however, may actually mean good news for real estate.
Mark Fleming, Chief Economist at First American, discussed the situation in a recent report,
“Global events and uncertainty…impact the U.S. economy, and more specifically, the U.S. housing market…U.S. bonds, backed by the full faith and credit of the U.S. government, are widely considered the safest investments in the world. When global investors sense increased uncertainty, there is a ‘flight to safety’ in U.S. Treasury bonds, which causes their price to go up, and their yield to go down.”
Last week, in a HousingWire article, Kathleen Howley reaffirmed Fleming’s point,
“The death toll from the coronavirus already has passed Severe Acute Respiratory Syndrome, or SARS, that bruised the world’s economy in 2003…That’s making investors around the world anxious, and when they get anxious, they tend to sell off stocks and seek the safe haven of U.S. bonds. An increase in competition for bonds means investors, including the people who buy mortgage-backed bonds, have to take lower yields. That translates into lower mortgage rates.”
The yield from treasury bonds is the rate investors receive when they purchase the bond. Historically, when the treasury rate moves up or down, the 30-year mortgage rate follows. Here’s a powerful graph showing the relationship between the two over the last 48 years: How might concerns about global challenges impact the housing market in 2020? Fleming explains,
“Even a small change in the 10-year Treasury due to increased uncertainty, let’s say a slight drop to 1.6 percent, would imply a 30-year, fixed mortgage rate as low as 3.3 percent. Assuming no change in household income, that would mean a house-buying power gain of $21,000, a five percent increase.”
Bottom Line
For a multitude of reasons, 2020 could be a challenging year. It seems, however, real estate will do just fine. As Fleming concluded in his report:
“Amid uncertainty, the house-buying power of U.S. consumers can benefit significantly.”
