

 Facebook
 X
X
 Pinterest
 Copy Link
Housing Market on Track to Beat Last Year’s Success


Back in March, as the nation’s economy was shut down because of the coronavirus, many were predicting the real estate market would face a major collapse. Some forecasts called for a 15-20% decline in transactions. However, six months later, it seems as though the housing market has fully recovered.
Mark Fleming, Chief Economist at First American, announced last week:
“Since hitting a low point during the initial stages of the pandemic, the only major industry to display immunity to the economic impacts of the coronavirus is the housing market. Housing has experienced a strong V-shaped recovery and is now exceeding pre-pandemic levels.”
The Economic & Strategic Research Group at Fannie Mae upgraded its forecast for home sales last week:
“Housing data over the past month continued to show a strong V-shape rebound, helping drive the broader economy. Existing home sales jumped to a pace not seen since 2006…We have substantially upgraded our forecasts for both new and existing home sales. For 2020, total home sales are now expected to be 1.3% higher than in 2019.”
The National Association of Realtors (NAR) agrees. In their last Pending Sales Report, NAR shared projections from Chief Economist Lawrence Yun:
“Yun forecasts existing-home sales to ramp up to 5.8 million in the second half. That expected rebound would bring the full-year level of existing-home sales to 5.4 million, a 1.1% gain compared to 2019.”
Yun’s forecast for 2021 was even more optimistic, stating, “Home sales will ramp up again next year, increasing between 8% – 12%.”
Bottom Line
The housing market has come roaring back and looks as though it may even surpass last year’s success.
Frank Martell, President and CEO of CoreLogic, hit the nail on the head when he said, “On an aggregated level, the housing economy remains rock solid despite the shock and awe of the pandemic.”
Why Pricing Your Home Right Matters This Fall [INFOGRAPHIC]
![Why Pricing Your Home Right Matters This Fall [INFOGRAPHIC] | MyKCM](https://desireestanley.com/files/2020/09/20200925-MEM-1046x588-2.jpg)
![Why Pricing Your Home Right Matters This Fall [INFOGRAPHIC] | MyKCM](https://files.mykcm.com/2020/09/24122226/20200925-MEM-1046x588.jpg)
Some Highlights
- As a seller today, you may think pricing your home on the high end will result in a higher final sale price, but the opposite is actually true.
- To sell your home quickly and for the best possible price, you should eliminate buyer concerns by pricing your home competitively right from the start.
- Let’s connect today to make sure you have the guidance you need to price your home right this fall.
Home Equity Gives Sellers Options in Today’s Market

Homeownership is one of the best ways to invest in your financial future, especially as your home equity grows. Home equity is a form of forced savings that can work to your advantage as the value of your home appreciates. Across the country, home equity was increasing before the health crisis swept our nation, and it continues to grow throughout the year, giving sellers powerful options in this market.
According to the just-released Q2 Homeowner Equity Insights Report by CoreLogic:
“U.S. homeowners with mortgages (roughly 63% of all properties) have seen their equity increase by a total of nearly $620 billion since the second quarter of 2019, an increase of 6.6%, year over year.”
Dr. Frank Nothaft, Chief Economist for CoreLogic, attributes much of the equity growth to rising home prices:
“The CoreLogic Home Price Index registered a 4.3% annual rise in prices through June, which supported an increase in home equity.”
As the map below shows, CoreLogic also indicates that home equity is increasing in every state:
“In the second quarter of 2020, the average homeowner gained approximately $9,800 in equity during the past year.”

What Does This Mean for Sellers?
When equity is rising, as it is today, you may have more invested in your home than you realize. Mark Fleming, Chief Economist at First American, notes:
“As homeowners gain equity in their homes, they are more likely to consider using that equity to purchase a larger or more attractive home – the wealth effect of rising equity. In today’s housing market, fast rising demand against the limited supply of homes for sale has resulted in continued house price appreciation.”
If you’ve been considering making a move – whether that’s to get into a bigger home or to downsize to a smaller one – it’s a great time to reach out to a real estate professional to learn how to put your equity to work for you. You may be in a position to pay that equity forward toward your next home purchase and afford it sooner rather than later.
Bottom Line
If you’re thinking of selling, let’s connect so you can take advantage of what the current market has to offer today.
Home Builder Confidence Hits All-Time Record

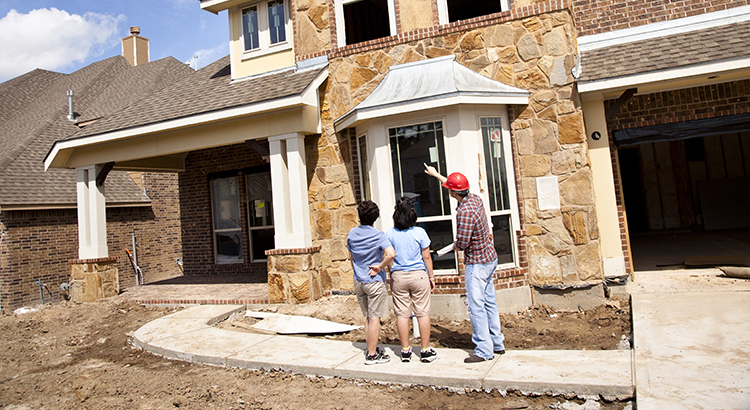
Last week, the National Association of Home Builders (NAHB) reported their Housing Market Index (HMI) hit an all-time high in the 35-year history of the series with a score of 83. The index gauges builder perceptions of current single-family home sales and sale expectations for the next six months, as well as the traffic of prospective buyers of new homes.
As the following chart shows, confidence dropped dramatically when stay-in-place orders were originally mandated earlier this year. Since then, it has soared back. Looking at the three-month moving averages for HMI scores, confidence increased in every region of the country:
- The Northeast increased 11 points to 76
- The Midwest jumped 9 points to 72
- The South rose 8 points to 79
- The West increased 7 points to 85
Confidence Is Validated by the Numbers
This confidence is definitely warranted. According to a recent NAHB report, single-family housing starts increased 4.1% to a 1.02 million annual rate, and single-family permits increased 6% to a 1.04 million unit rate, meaning newly constructed homes are on the rise.
A separate report from the Mortgage Bankers Association (MBA) shows mortgage applications for new home purchases increased by 33.3% compared to a year ago. Joel Kan, Associate Vice President of Economic and Industry Forecasting at MBA, commented on the numbers:
“The housing market continued to exceed expectations in August, as housing demand for new homes stayed strong and the job market continued to recover…The new home market has maintained its path of recovery throughout the summer, and record-low mortgage rates and households seeking more space will likely continue to drive demand into the fall.”
Bottom Line
If you’re thinking about putting your house on the market but are afraid you may not find a home to buy, let’s connect to discuss new construction opportunities in our area.
The Cost of a Home Is Far More Important than the Price

Housing inventory is at an all-time low. There are 39% fewer homes for sale today than at this time last year, and buyer demand continues to set records. Zillow recently reported:
“Newly pending sales are up 25.5% compared to the same week last year, the highest year-over-year increase in the weekly Zillow database.”
Whenever there is a shortage in supply of an item that’s in high demand, the price of that item increases. That’s exactly what’s happening in the real estate market right now. CoreLogic’s latest Home Price Index reports that values have increased by 5.5% over the last year.
This is great news if you’re planning to sell your house; on the other hand, as either a first-time or repeat buyer, this may instead seem like troubling news. However, purchasers should realize that the price of a house is not as important as the cost. Let’s break it down.
There are several factors that influence the cost of a home. The two major ones are the price of the home and the interest rate at which a buyer can borrow the funds necessary to purchase the home.
Last week, Freddie Mac announced that the average interest rate for a 30-year fixed-rate mortgage was 2.87%. At this time last year, the rate was 3.73%. Let’s use an example to see how that difference impacts the true cost of a home.
Assume you purchased a home last year and took out a $250,000 mortgage. As mentioned above, home values have increased by 5.5% over the last year. To buy that same home this year, you would need to take out a mortgage of $263,750.
How will your monthly mortgage payment change based on today’s lower mortgage rate?
This table calculates the difference in your monthly payment: That’s a savings of $61 monthly, which adds up to $732 annually and $21,960 over the life of the loan.
Bottom Line
Even though home values have appreciated, it’s a great time to buy a home because mortgage rates are at historic lows.
Is the Economic Recovery Beating All Projections?


Earlier this year, many economists and market analysts were predicting an apocalyptic financial downturn that would potentially rattle the U.S. economy for years to come. They immediately started to compare it to the Great Depression of a century ago. Six months later, the economy is still trying to stabilize, but it is evident that the country will not face the total devastation projected by some. As we continue to battle the pandemic, forecasts are now being revised upward. The Wall Street Journal (WSJ) just reported:
“The U.S. economy and labor market are recovering from the coronavirus-related downturn more quickly than previously expected, economists said in a monthly survey.
Business and academic economists polled by The Wall Street Journal expect gross domestic product to increase at an annualized rate of 23.9% in the third quarter. That is up sharply from an expectation of an 18.3% growth rate in the previous survey.”
What Shape Will the Recovery Take?
Economists have historically cast economic recoveries in the form of one of four letters – V, U, W, or L.
A V-shaped recovery is all about the speed of the recovery. This quick recovery is treated as the best-case scenario for any economy that enters a recession. NOTE: Economists are now also using a new term for this type of recovery called the “Nike Swoosh.” It is a form of the V-shape that may take several months to recover, thus resembling the Nike Swoosh logo.
A U-shaped recovery is when the economy experiences a sharp fall into a recession, like the V-shaped scenario. In this case, however, the economy remains depressed for a longer period of time, possibly several years, before growth starts to pick back up again.
A W-shaped recovery can look like an economy is undergoing a V-shaped recovery until it plunges into a second, often smaller, contraction before fully recovering to pre-recession levels.
An L-shaped recovery is seen as the worst-case scenario. Although the economy returns to growth, it is at a much lower base than pre-recession levels, which means it takes significantly longer to fully recover.
Many experts predicted that this would be a dreaded L-shaped recovery, like the 2008 recession that followed the housing market collapse. Fortunately, that does not seem to be the case.
The same WSJ survey mentioned above asked the economists which letter this recovery will most resemble. Here are the results:
What About the Unemployment Numbers?
It’s difficult to speak positively about a jobs report that shows millions of Americans are still out of work. However, when we compare it to many forecasts from earlier this year, the numbers are much better than most experts expected. There was talk of numbers that would rival the Great Depression when the nation suffered through four consecutive years of unemployment over 20%.
The first report after the 2020 shutdown did show a 14.7% unemployment rate, but much to the surprise of many analysts, the rate has decreased each of the last three months and is now in the single digits (8.4%).
Economist Jason Furman, Professor at Harvard University‘s John F. Kennedy School of Government and the Chair of the Council of Economic Advisers during the previous administration, recently put it into context:
“An unemployment rate of 8.4% is much lower than most anyone would have thought it a few months ago. It is still a bad recession but not a historically unprecedented event or one we need to go back to the Great Depression for comparison.”
The economists surveyed by the WSJ also forecasted unemployment rates going forward:
- 2021: 6.3%
- 2022: 5.2%
- 2023: 4.9%
The following table shows how the current employment situation compares to other major disruptions in our economy:
Bottom Line
The economic recovery still has a long way to go. So far, we are doing much better than most thought would be possible.
Homes Across the Country Are Selling Fast [INFOGRAPHIC]
![Homes Across the Country Are Selling Fast [INFOGRAPHIC] | My KCM](https://desireestanley.com/files/2020/09/20200918-MEM-1046x1575-2.jpg)
![Homes Across the Country Are Selling Fast [INFOGRAPHIC] | My KCM](https://files.mykcm.com/2020/09/17125830/20200918-MEM-1046x1575.jpg)
Some Highlights
- Buyers are actively searching for and purchasing homes at a record-breaking pace. According to the latest report from the National Association of Realtors (NAR), in July, 68% of homes were on the market for less than a month.
- With homes moving from listing day to pending sale in an average of just 22 days, it’s a great time to sell a house.
- Let’s connect today so you can make your move while buyers are scooping homes up faster than they’re coming to market.
How Low Inventory May Impact the Housing Market This Fall


Real estate continues to be called the ‘bright spot’ in the current economy, but there’s one thing that may hold the housing market back from achieving its full potential this year: the lack of homes for sale.
Buyers are actively searching for and purchasing homes, looking to capitalize on today’s historically low-interest rates, but there just aren’t enough houses for sale to meet that growing need. Sam Khater, Chief Economist at Freddie Mac, explains:
“Mortgage rates have hit another record low due to a late summer slowdown in the economic recovery…These low rates have ignited robust purchase demand activity…However, heading into the fall it will be difficult to sustain the growth momentum in purchases because the lack of supply is already exhibiting a constraint on sales activity.”
According to the National Association of Realtors (NAR), right now, unsold inventory sits at a 3.1-month supply at the current sales pace. To have a balanced market where there are enough homes for sale to meet buyer demand, the market needs inventory for 6 months. Today, we’re nowhere near where that number needs to be. If the trend continues, it will get even harder to find homes to purchase this fall, and that may slow down potential buyers. Danielle Hale, Chief Economist at realtor.com, notes:
“The overall lack of sustained new listings growth could put a dent in fall home sales despite high interest from home shoppers, because new listings are key to home sales.”
The realtor.com Weekly Recovery Report keeps an eye on the number of listings coming into the market (houses available for sale) and the total number of listings staying in the market compared to the previous year (See graph below): Buyers are clearly scooping up homes faster than they’re being put up for sale. The number of total listings (the orange line) continues to decline even as new listings (the blue line) are coming to the market. Why? Javier Vivas, Director of Economic Research at realtor.com, notes:
“The post-pandemic period has brought a record number of homebuyers back into the market, but it’s also failed to bring a consistent number of sellers back. Homes are selling faster, and sales are still on an upward trend, but rapidly disappearing inventory also means more home shoppers are being priced out. If we don’t see material improvement to supply in the next few weeks, we could see the number of transactions begin to dwindle again even as the lineup of buyers continues to grow.”
Does this mean it’s a good time to sell?
Yes. If you’re thinking about selling your house, this fall is a great time to make it happen. There are plenty of buyers looking for homes to purchase because they want to take advantage of low-interest rates. Realtors are also reporting an average of 3 offers per house and an increase in bidding wars, meaning the demand is there and the opportunity to sell for the most favorable terms is in your favor as a seller.
Bottom Line
If you’re considering selling your house, this is the perfect time to connect so we can talk about how you can benefit from the market trends in our local area.
The Surging Real Estate Market Continues to Climb


Earlier this year, realtor.com announced the release of the Housing Recovery Index, a weekly guide showing how the pandemic has impacted the residential real estate market. The index leverages a weighted average of four key components of the housing industry by tracking each of the following:
- Housing Demand – Growth in online search activity
- Home Price – Growth in asking prices
- Housing Supply – Growth of new listings
- Pace of Sales – Difference in time-on-market
The index compares the current status “to the January 2020 market trend, as a baseline for pre-COVID market growth. The overall index is set to 100 in this baseline period. The higher a market’s index value, the higher its recovery and vice versa.”
The graph below charts the index by showing how the real estate market started out strong in early 2020, and then dropped dramatically at the beginning of March when the pandemic paused the economy. It also shows the strength of the recovery since the beginning of May. Today, the index stands at its highest point all year, including the time prior to the economic shutdown.
The Momentum Is Still Building
Though there is some evidence that the overall economic recovery may be slowing, the housing market is still gaining momentum. Zillow tracks the number of homes that are put into contract on a weekly basis. Their latest report confirms that buyer demand is continuing to dramatically outpace this same time last year, and the percent increase over last year is growing. Clearly, the housing market is not only outperforming the grim forecasts from earlier this year, but it is also eclipsing the actual success of last year.
Frank Martell, President and CEO of CoreLogic, explains it best:
“On an aggregated level, the housing economy remains rock solid despite the shock and awe of the pandemic.”
Bottom Line
Whether you’re considering buying or selling, staying on top of the real estate market over the coming months will be essential to your success.
Is Now a Good Time to Move?


How long have you lived in your current home? If it’s been a while, you may be thinking about moving. According to the latest Profile of Home Buyers and Sellers by the National Association of Realtors (NAR), in 2019, homeowners were living in their homes for an average of 10 years. That’s a long time to time to be in one place, considering the average length of time homeowners used to stay put hovered closer to 6 years.
With today’s changing homebuyer needs, especially given how the current health crisis has altered our daily lifestyles, many homeowners are reconsidering where they’re at and thinking about moving to a home with more space for their families. Here’s why it might be a great time to make that happen.
The real estate market has changed in many ways over the past 10 years, and current homeowners are earning much more equity today than they used to have. According to CoreLogic, in the first quarter of 2020 alone, the average homeowner gained approximately $9,600 in equity. If you’re considering selling your house right now, you may have accumulated more equity to put toward a move than you realize.
Dialing back 10 years, many homeowners also locked in a fairly low mortgage rate. In 2010, the average rate was only 4.09%. This motivated homeowners to stay in their houses longer than usual to keep their rate low, rather than moving. Just last Thursday, however, average mortgage rates hit a new historic low at 2.86%. Sam Khater, Chief Economist at Freddie Mac explains:
“Mortgage rates have hit another record low due to a late summer slowdown in the economic recovery…These low rates have ignited robust purchase demand activity, which is up twenty-five percent from a year ago and has been growing at double digit rates for four consecutive months.”
Ten years ago, we couldn’t have imagined a mortgage rate under 3%. Looking at the math today, making a move into a new home and locking in a significantly lower rate than you have now could save you greatly on a monthly basis, and over the life of your loan (See chart below): As the example shows, you can save a substantial amount every month if you qualify for today’s low mortgage rate, and the savings can really add up over the life of a 30-year fixed-rate loan.
Bottom Line
As a homeowner, you have a huge opportunity to move up right now. Whether you want to save more each month or get more home for your money based on your family’s changing needs, it’s a great time to connect to discuss the market in our area. Buyers are actively looking for more homes to buy, and you can win big by making a move if the time is right for you.
