Unemployment Report: No Need to Be Terrified


Last Friday, the Bureau of Labor Statistics (BLS) released its latest jobs report. It revealed that the economic shutdown made necessary by COVID-19 caused the unemployment rate to jump to 14.7%. Many anticipate that next month the percentage could be even higher. These numbers represent the extreme hardship so many families are experiencing right now. That pain should not be understated.
However, the long-term toll the pandemic will cause should not be overstated either. There have been numerous headlines claiming the current disruption in the economy is akin to the Great Depression, and many of those articles are calling for total Armageddon. Some experts are stepping up to refute those claims.
In a Wall Street Journal (WSJ) article this past weekend, Josh Zumbrun, a national economics correspondent for the Journal explained:
“News stories often describe the coronavirus-induced global economic downturn as the worst since the Great Depression…the comparison does more to terrify than clarify.”
Zumbrun goes on to explain:
“From 1929 to 1933, the economy shrank for 43 consecutive months, according to contemporaneous estimates. Unemployment climbed to nearly 25% before slowly beginning its descent, but it remained above 10% for an entire decade…This time, many economists believe a rebound could begin this year or early next year.”
Here is a graph comparing current unemployment numbers (actual and projected) to those during the Great Depression: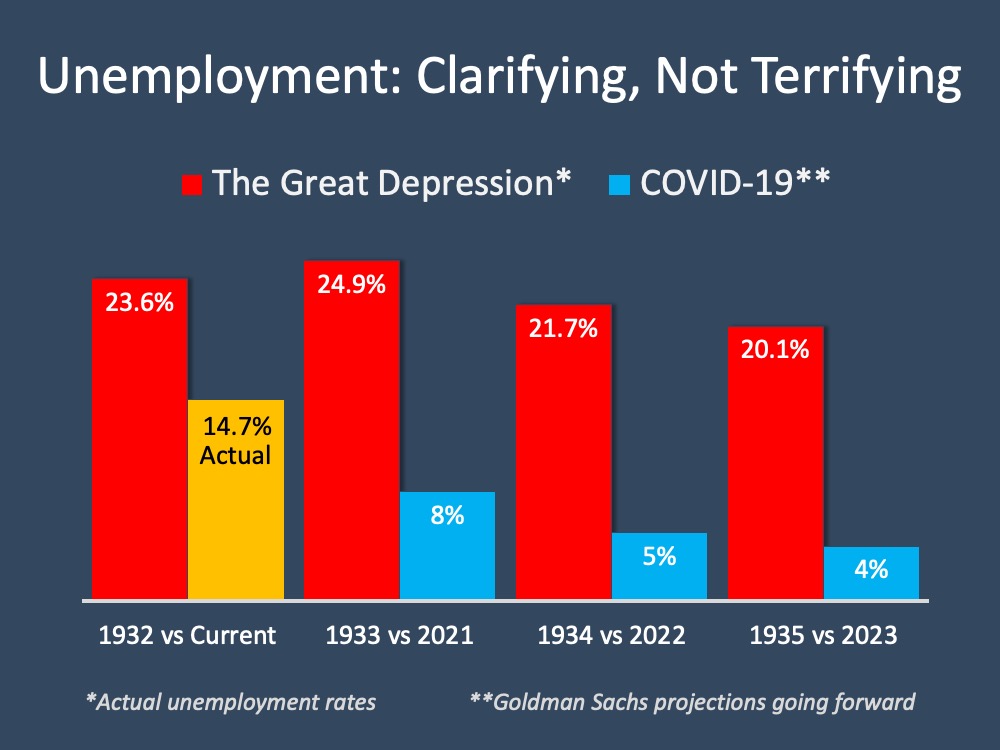 Clearly, the two unemployment situations do not compare.
What makes this time so different?
This was not a structural collapse of the economy, but instead a planned shutdown to help mitigate the virus. Once the virus is contained, the economy will immediately begin to recover. This is nothing like what happened in the 1930s. In the same WSJ article mentioned above, former Federal Reserve Chairman Ben Bernanke, who has done extensive research on the depression in the 1930s, explained:
“The breakdown of the financial system was a major reason for both the Great Depression and the 2007-09 recession.” He went on to say that today – “the banks are stronger and much better capitalized.”
What about the families and small businesses that are suffering right now?
The nation’s collective heart goes out to all. The BLS report, however, showed that ninety percent of the job losses are temporary. In addition, many are getting help surviving this pause in their employment status. During the Great Depression, there were no government-sponsored unemployment insurance or large government subsidies as there are this time.
Today, many families are receiving unemployment benefits and an additional $600 a week. The stimulus package is helping many companies weather the storm. Is there still pain? Of course. The assistance, however, is providing much relief until most can go back to work.
Bottom Line
We should look at the current situation for what it is – a predetermined pause placed on the economy. The country will recover once the pandemic ends. Comparisons to any other downturn make little sense. Bernanke put it best:
“I don’t find comparing the current downturn with the Great Depression to be very helpful. The expected duration is much less, and the causes are very different.”
Will Home Values Appreciate or Depreciate in 2020?


With the housing market staggered to some degree by the health crisis the country is currently facing, some potential purchasers are questioning whether home values will be impacted. The price of any item is determined by supply as well as the market’s demand for that item.
Each month the National Association of Realtors (NAR) surveys “over 50,000 real estate practitioners about their expectations for home sales, prices and market conditions” for the REALTORS Confidence Index.
Their latest edition sheds some light on the relationship between seller traffic (supply) and buyer traffic (demand) during this pandemic.
Buyer Demand
The map below was created after asking the question: “How would you rate buyer traffic in your area?”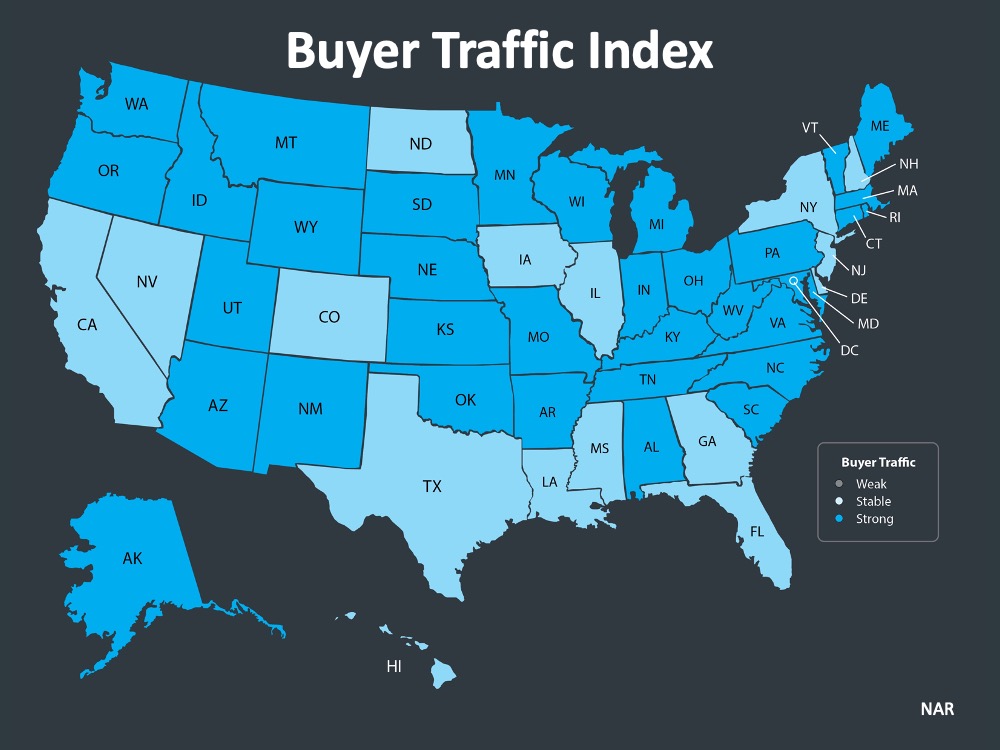 The darker the blue, the stronger the demand for homes is in that area. The survey shows that in 34 of the 50 U.S. states, buyer demand is now ‘strong’ and 16 of the 50 states have a ‘stable’ demand.
Seller Supply
The index also asks: “How would you rate seller traffic in your area?”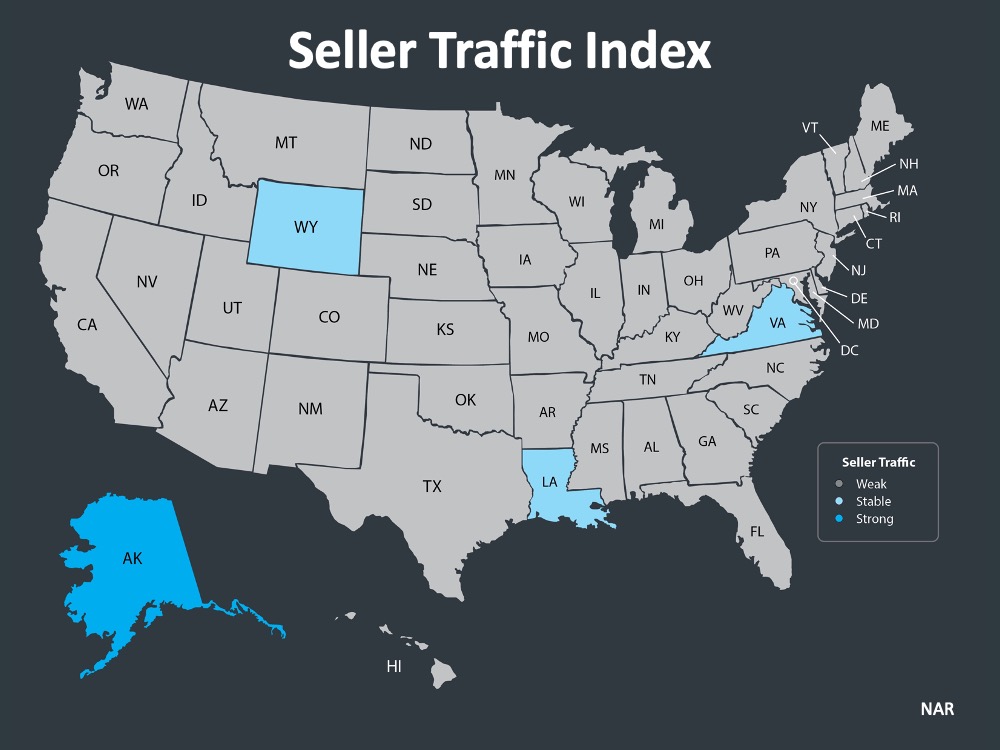 As the map above indicates, 46 states and Washington, D.C. reported ‘weak’ seller traffic, 3 states reported ‘stable’ seller traffic, and 1 state reported ‘strong’ seller traffic. This means there are far fewer homes on the market than what is needed to satisfy the needs of buyers looking for homes right now.
With demand still stronger than supply, home values should not depreciate.
What are the experts saying?
Here are the thoughts of three industry experts on the subject:
“We note that inventory as a percent of households sits at the lowest level ever, something we believe will limit the overall degree of home price pressure through the year.”
Mark Fleming, Chief Economist, First American:
“Housing supply remains at historically low levels, so house price growth is likely to slow, but it’s not likely to go negative.”
“Two forces prevent a collapse in house prices. First, as we indicated in our earlier research report, U.S. housing markets face a large supply deficit. Second, population growth and pent up household formations provide a tailwind to housing demand.”
Bottom Line
Looking at these maps and listening to the experts, it seems that prices will remain stable throughout 2020. If you’re thinking about listing your home, let’s connect to discuss how you can capitalize on the somewhat surprising demand in the market now.


 Facebook
 X
X
 Pinterest
 Copy Link


![How to Test-Drive a Neighborhood While Sheltering in Place [INFOGRAPHIC] | MyKCM](https://desireestanley.com/files/2020/05/20200501-MEM-1046x775.jpg)
![How to Test-Drive a Neighborhood While Sheltering in Place [INFOGRAPHIC] | MyKCM](https://files.mykcm.com/2020/04/30083703/20200501-MEM-1046x775.jpg)






![How Technology is Helping Buyers Navigate the Home Search Process [INFOGRAPHIC] | MyKCM](https://desireestanley.com/files/2020/04/20200417-MEM-Eng-1046x1308.png)
![How Technology is Helping Buyers Navigate the Home Search Process [INFOGRAPHIC] | MyKCM](https://files.mykcm.com/2020/04/16133213/20200417-MEM-Eng-1046x1308.png)
