Home Builder Confidence Hits All-Time Record

Last week, the National Association of Home Builders (NAHB) reported their Housing Market Index (HMI) hit an all-time high in the 35-year history of the series with a score of 83. The index gauges builder perceptions of current single-family home sales and sale expectations for the next six months, as well as the traffic of prospective buyers of new homes.
As the following chart shows, confidence dropped dramatically when stay-in-place orders were originally mandated earlier this year. Since then, it has soared back.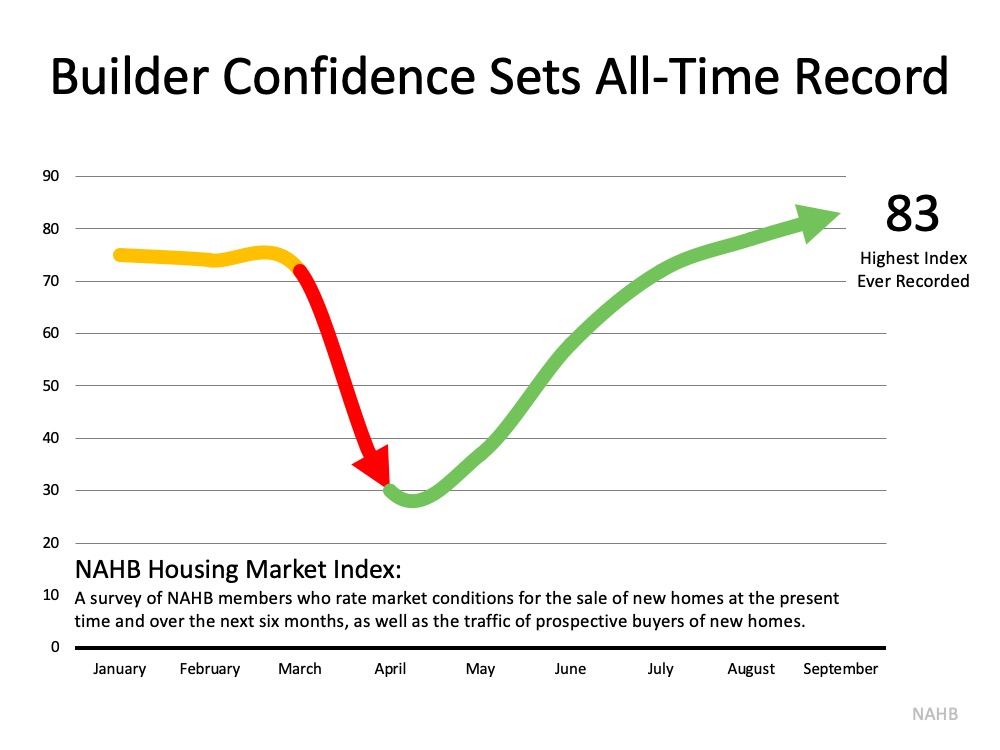 Looking at the three-month moving averages for HMI scores, confidence increased in every region of the country:
- The Northeast increased 11 points to 76
- The Midwest jumped 9 points to 72
- The South rose 8 points to 79
- The West increased 7 points to 85
Confidence Is Validated by the Numbers
This confidence is definitely warranted. According to a recent NAHB report, single-family housing starts increased 4.1% to a 1.02 million annual rate, and single-family permits increased 6% to a 1.04 million unit rate, meaning newly constructed homes are on the rise.
A separate report from the Mortgage Bankers Association (MBA) shows mortgage applications for new home purchases increased by 33.3% compared to a year ago. Joel Kan, Associate Vice President of Economic and Industry Forecasting at MBA, commented on the numbers:
“The housing market continued to exceed expectations in August, as housing demand for new homes stayed strong and the job market continued to recover…The new home market has maintained its path of recovery throughout the summer, and record-low mortgage rates and households seeking more space will likely continue to drive demand into the fall.”
Bottom Line
If you’re thinking about putting your house on the market but are afraid you may not find a home to buy, let’s connect to discuss new construction opportunities in our area.
The Surging Real Estate Market Continues to Climb


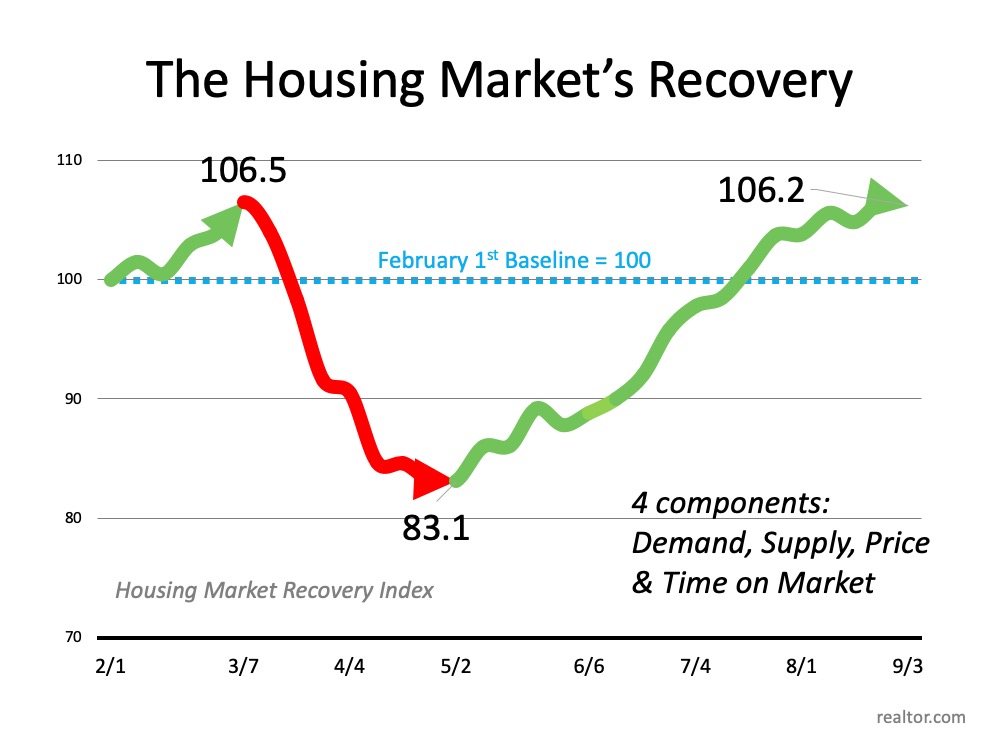
Earlier this year, realtor.com announced the release of the Housing Recovery Index, a weekly guide showing how the pandemic has impacted the residential real estate market. The index leverages a weighted average of four key components of the housing industry by tracking each of the following:
- Housing Demand – Growth in online search activity
- Home Price – Growth in asking prices
- Housing Supply – Growth of new listings
- Pace of Sales – Difference in time-on-market
The index compares the current status “to the January 2020 market trend, as a baseline for pre-COVID market growth. The overall index is set to 100 in this baseline period. The higher a market’s index value, the higher its recovery and vice versa.”
The graph below charts the index by showing how the real estate market started out strong in early 2020, and then dropped dramatically at the beginning of March when the pandemic paused the economy. It also shows the strength of the recovery since the beginning of May.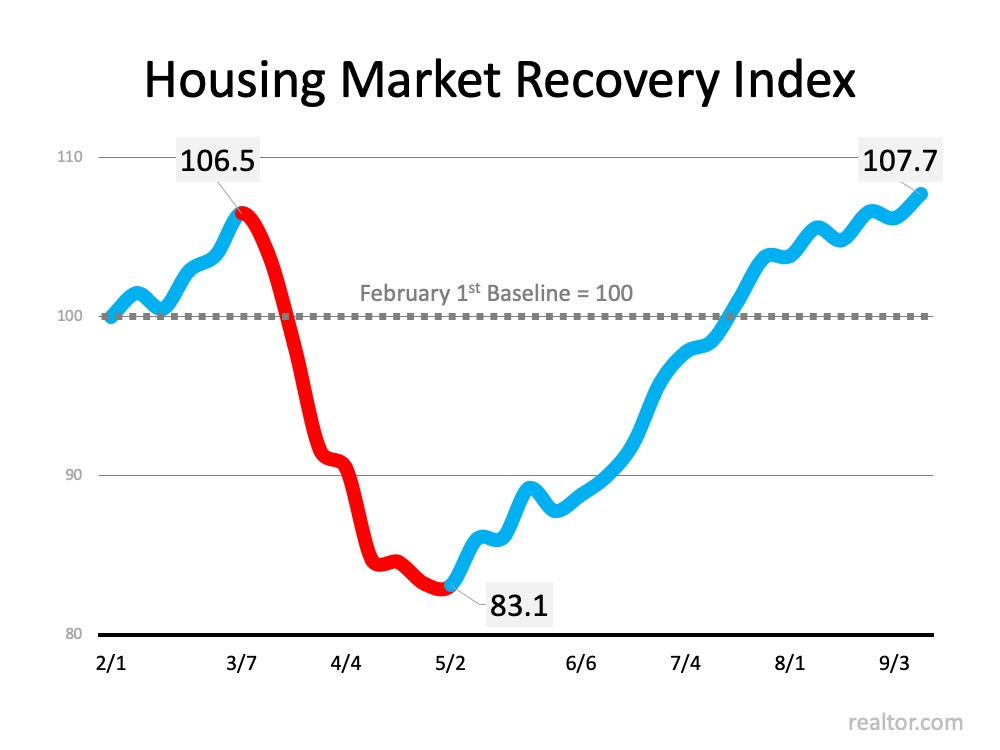 Today, the index stands at its highest point all year, including the time prior to the economic shutdown.
The Momentum Is Still Building
Though there is some evidence that the overall economic recovery may be slowing, the housing market is still gaining momentum. Zillow tracks the number of homes that are put into contract on a weekly basis. Their latest report confirms that buyer demand is continuing to dramatically outpace this same time last year, and the percent increase over last year is growing.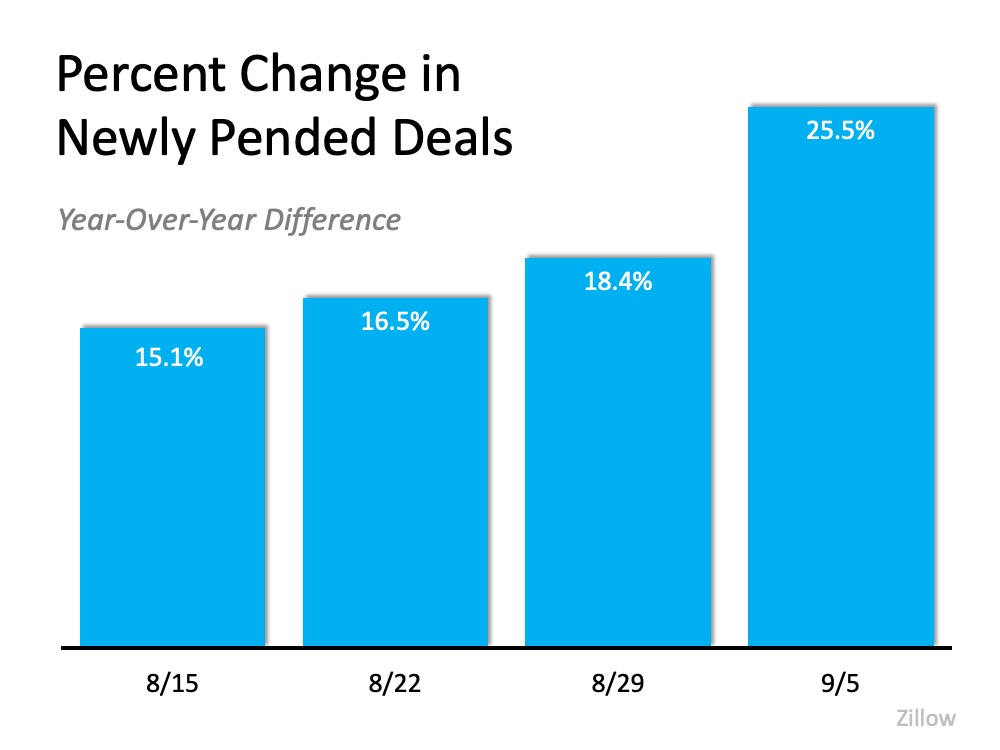 Clearly, the housing market is not only outperforming the grim forecasts from earlier this year, but it is also eclipsing the actual success of last year.
Frank Martell, President and CEO of CoreLogic, explains it best:
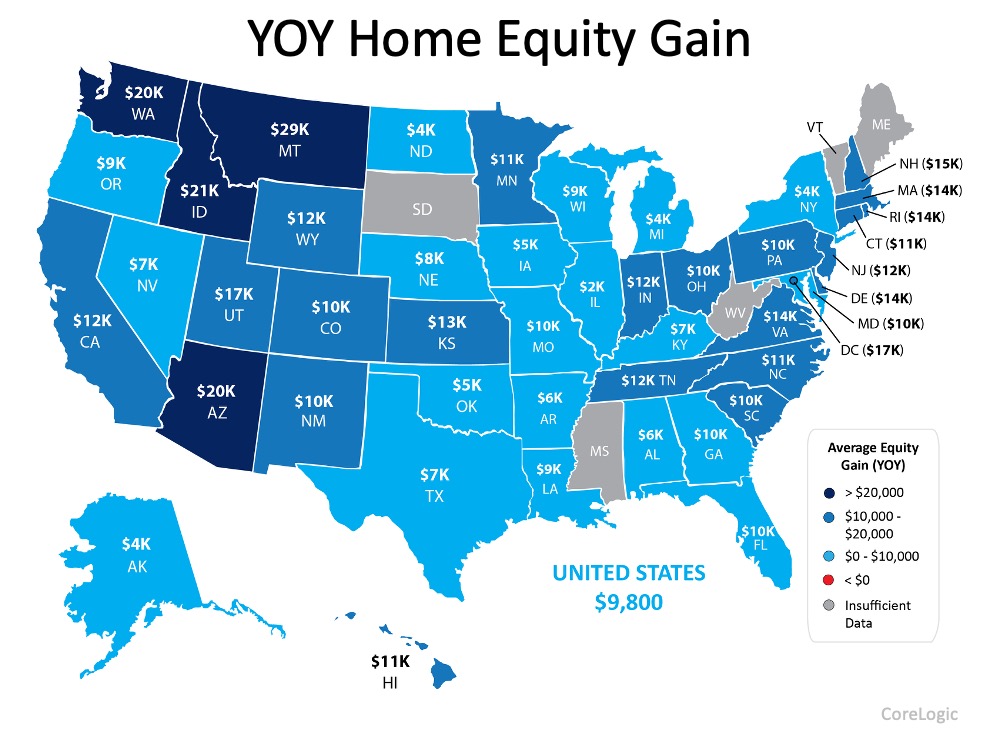
“On an aggregated level, the housing economy remains rock solid despite the shock and awe of the pandemic.”
Bottom Line
Whether you’re considering buying or selling, staying on top of the real estate market over the coming months will be essential to your success.


 Facebook
 X
X
 Pinterest
 Copy Link
![Why Pricing Your Home Right Matters This Fall [INFOGRAPHIC] | MyKCM](https://desireestanley.com/files/2020/09/20200925-MEM-1046x588-2.jpg)
![Why Pricing Your Home Right Matters This Fall [INFOGRAPHIC] | MyKCM](https://files.mykcm.com/2020/09/24122226/20200925-MEM-1046x588.jpg)


![Homes Across the Country Are Selling Fast [INFOGRAPHIC] | My KCM](https://desireestanley.com/files/2020/09/20200918-MEM-1046x1575-2.jpg)
![Homes Across the Country Are Selling Fast [INFOGRAPHIC] | My KCM](https://files.mykcm.com/2020/09/17125830/20200918-MEM-1046x1575.jpg)


![Virtual School Is Changing Homebuyer Needs [INFOGRAPHIC] | My KCM](https://desireestanley.com/files/2020/09/20200911-MEM-1046x1580-2.jpg)
![Virtual School Is Changing Homebuyer Needs [INFOGRAPHIC] | My KCM](https://files.mykcm.com/2020/09/10111103/20200911-MEM-1046x1580.jpg)


